Some time ago, just after
Morpheuz posted
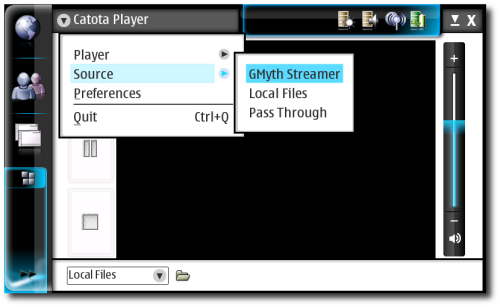
"Prison Break: Freedom for your videos", people were asking for UI being able to play it, so I joined the bandwagon and started to write a MPlayer frontend in Python, "Catota" was born.
Catota, which means "snot" in Brazil (see
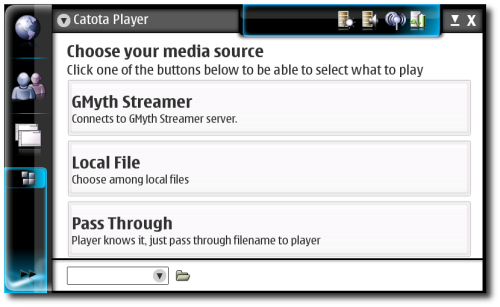
README), is a quick hack and will not evolve as yet-another-player, however it's usable and extensible, so I can continue my experiments. As the screenshots show, it has a plugin system to enable various sources, featuring now
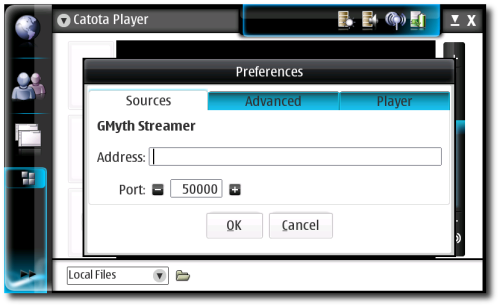
"GMyth Streamer" (broken, see below),
"Local Files" and
"Pass Through" (to pass anything to MPlayer, like smb://a/b/c).
These experiments were really useful for both Catota and
GMyth Streamer. I've discovered that MPlayer for Maemo now uses dspmp3sink by default, and that sucks a lot! Hell, just being back to ffmpeg codecs and esd output solved a lot of problems, that's why Catota ships with this by default. Also, MPlayer crashes more than expected when using Xv output and toggle fullscreen.
On GMyth Streamer front, what Artur (Morpheuz) did great was to discover MEncoder settings, but his server was a bit bad (we share the same house here in Recife, so I know he did the entire code on a Sunday night!), so I got some knowledge with Python and its libraries (SocketServer and friends) and give him a hand, providing a Catota-Server as example. This Catota-Server is now the base of GMyth Streamer! Great! (However now I need to update GMyth Streamer source to use the new schema).
On the Catota features, I did a really nice thing that should be adopted by every Maemo application:
auto-save every input field. Catota always remember last volume, mute, selected file, entered URL... It just sucks having to set those every time you start the application.
Source is available at:
http://barbieri-playground.googlecode.com/svn/maemo/catota/ (SVN)
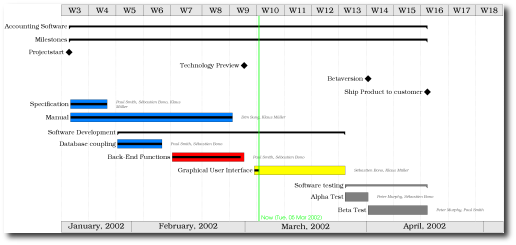
Last week I was faced with a problem I had 2 years ago: generating Gantt graphs for our projects. While at IBM/LTC, I found TaskJuggler to be a nice tool, very developer oriented, but it lacked means to generate nice graphs... I've requested this feature in 2005, it got implemented by Chris, but one issue still remain: how to generate those automatically, without any UI, and in a scalable format to be used in our LaTeX reports and maybe some multi-page poster.
So this weekend I implemented this tool and it's quite usable already! It's a Python+ElementTree+PyX application that parsers TaskJuggler's XML (tjx) and output PDF, PS or EPS, with PDF and PS being able to output segmented, multi page, poster documents.
Chenca is developing a more report oriented graph, generating LaTeX tables instead of drawings, he promised to publish it as well ;-)
Source is available at: http://barbieri-playground.googlecode.com/svn/python/taskjuggler-utils/ (SVN)